Preparing Diagnostic Information
- 3 minutes to read
If the editor does not work as expected, for example, some content is never loaded, or you notice some errors, please contact our support team. It will help if you not just report a problem but also provide us with the diagnostic information. This article explains how to gather the information that helps troubleshoot the problem.
It will help a lot if we can see the problem ourselves. If the editor is available online, prepare instructions on how we can reach it, including usernames and passwords, if required, and how to reproduce the problem.
If, for any reason you cannot provide us with access to your editor, please prepare diagnostic information using the Developer Tools of a browser as explained below.
Opening Developer Tools
To open the developer console, you can press F12 or use Inspect element/Inspect menu item and then click the Console tab.
You can also use keyboard shortcuts to open the developer console window:
- In Chrome, press
Ctrl+Shift+J(on Windows) orCtrl+Option+J(on Mac). - In Firefox, press
Ctrl+Shift+K(on Windows) orCtrl+Option+K(on Mac). - In Safari, you first need to turn on the Develop menu (Preferences > Advanced > Show Develop menu in the menu bar) and then press
Ctrl+Option+C.
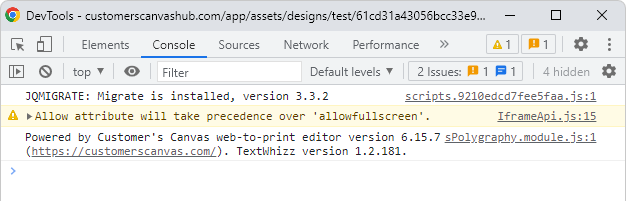
Console errors
First, check the console messages. If there are red errors from the Design Editor, copy and send them to us. To select only the editor's errors, you can apply a filter by entering a part of the URL where your editor is deployed in the Filter box.
Network errors
You may also need to check the network activity. In Developer Tools, click the Network tab and find red messages. If you see that some URLs respond with an error or take too long to load, then prepare a HAR file and send it to us.
Now, let's learn how to create a HAR file in your browser.
Generating HAR files for Chrome or Microsoft Edge
- Open the page on which you are experiencing the problem.
- Click the menu button (three ellipses) and then click More tools > Developer Tools.
- When the panel opens, click the Network tab.
- Verify that the Record button in the upper-left corner is red. If it is grey, click it to start the Network recording log.
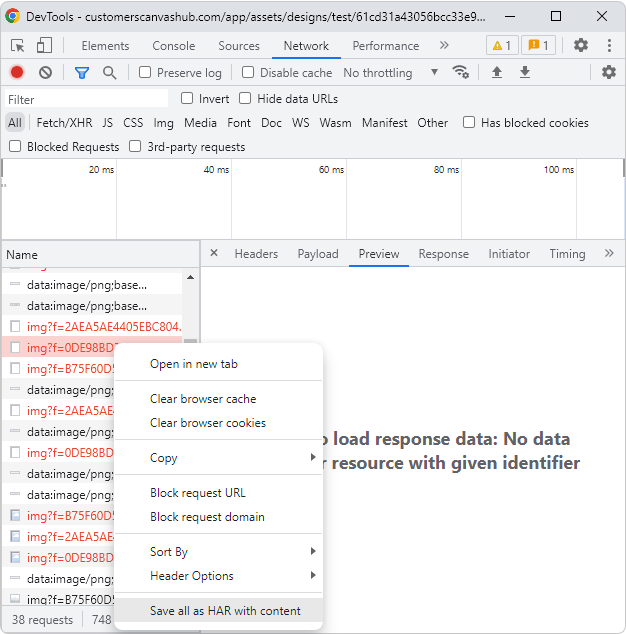
- Click the Clear button to clear out the existing logs.
- Reproduce the problem, right-click any network request, and click Save all as HAR with Content.
Generating HAR files for Firefox
- Open the page on which you are experiencing the problem.
- Click the menu button in the upper-right corner and then click More tools > Web Developer Tools.
- When the panel opens, click the Network tab.
- Reproduce the problem, right-click any network request, and click Save all as HAR.
Generating HAR files for Safari
Click on the Develop menu and then select Show Web Inspector.
Note
To display the Develop menu, you may need to click Safari > Preferences > Advanced and select Show Develop menu in menu bar.
Click the Network tab and reproduce the problem.
Click the Export button and save the file.
Verifying HAR files
To check if the HAR file is correctly saved, you can open it in your browser. For example, open Chrome, open Developer Tools (press F12), click the Network tab, and drag your HAR file. If you see the same messages as when you recorded it, then the file is correct.